2012 Presidential Election Maps
Presenting an alternative model to the Red State vs Blue State mapping techniques
This is what democracy looks like.
Another election cycle has passed us by, and like most cartographers, I have sharp critiques on the major media outlets portrayal of the current Red State - Blue State representation and for the subsequent misinterpretation of these maps by the general viewing public that ensued. Voter representation, like any geographic social dataset is highly complex. Traditional election maps misrepresent political support because the area of a geographic unit on the map in not equivalent to the number of votes cast there and the contentiousness of the voter opinion is rarely ever mapped. In order to better represent election maps we must take into account the level of variability in the voter dataset (i.e., the magnitude of votes cast in the enumeration unit and the diversity of opinion within the electorate) and then represent the data in a way that is " more socially just" (Dorling, 1993, p. 171) by visually equalizing the basemap or the attribute data in such a way to better promote the idea that smaller or more densely packed counties or states carry as much or even more electoral weight than large expanses of low inhabited counties or states and that traditional red/blue binaries disenfranchise people with alternative opinions.I present a model for representing election maps as a guide for cartographers to select a method of representation that best meets this combination of variability and visual weight in the enumeration unit with the goal of progressing the comprehension of alternative election map techniques. This work relies heavily on the work of Dorling, Roth, Gaster and Neuman.
Background
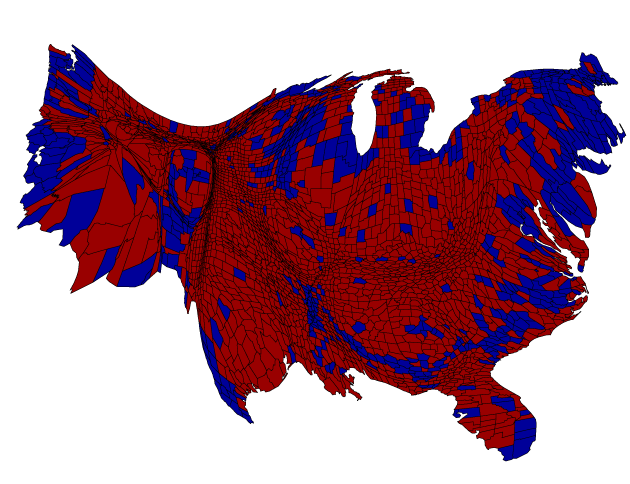
The most popular method for visually equalizing maps is the cartogram, or value-by-area map. Classified as being continuous or non-continuous, depending on its level of connectiveness or topology, cartograms often require the map reader to make large cognitive jumps in geographic imagination, as is the case for the popular Gaster-Neuman algorithm depicted at the onset of this article (you can download the ArcGIS script and create your own G-N cartogram here) or they require the manipulation of vector graphics in a a creative suite like Adobe Illustrator, such is the case for the Dorling cartogram or block cartogram (examples). Roth, et al., introduce an alternative to the cartogram, the "value by alpha" map (found here) that visually equalizes the basemap using opacity or transparency to equalize the map rather than size like the cartogram. My goal is to present a cache of mapping techniques that can easily be constructed using ArcGIS alone.My model demonstrates the ease and effectiveness of the value-by-alpha election map along with all the other typical thematic mapping techniques found within the ArcGIS suite.
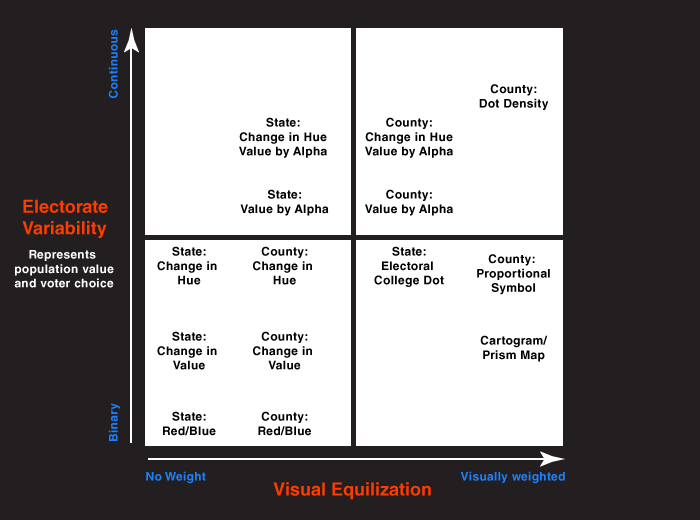
Modeling elections along a discrete-continuous and no weight-visually weighted continua
I define "Electorate Variability" as a continuum of values from a binary classification "red versus blue" to a perfectly continuous surface of electoral diversity. Intermediate stages of this continuum are changes in color value, changes in color hue, and value by alpha as well as changes in the thematic representation techniques from a discrete, abrupt representation to a continuous, smooth representation, e.g., proportinal symbol, dot, choropleth, etc. (Slocum, 2009, p.171).
Visual equalization, or adjusting the social variable visual weight to emphasize its importance can also be extended to the spatial resolution of the dataset, in this case using smaller enumeration units. A finer resolution such as county level data can emphasize urban areas versus rural areas, especially when we add a value-by-alpha layer, rather than generalizing the electorate to the state level, therefore, I include it in this model as equalization.
Implementing this Model
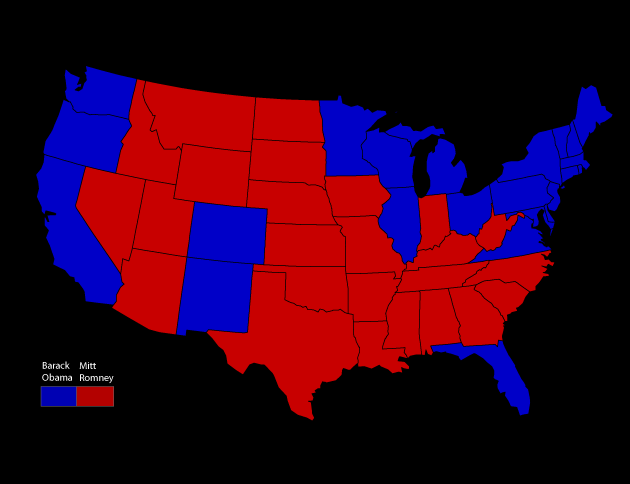
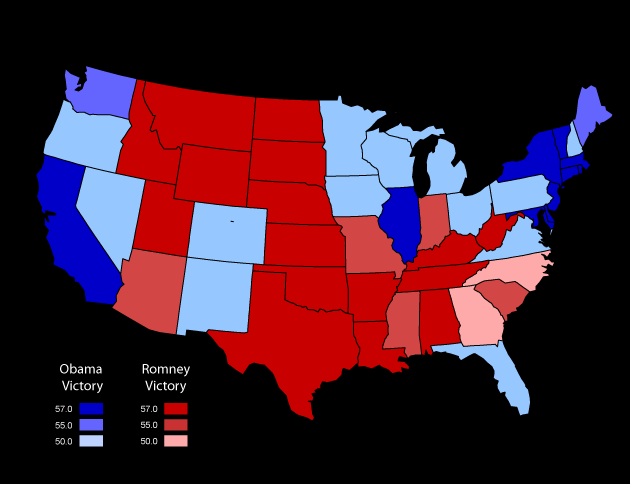
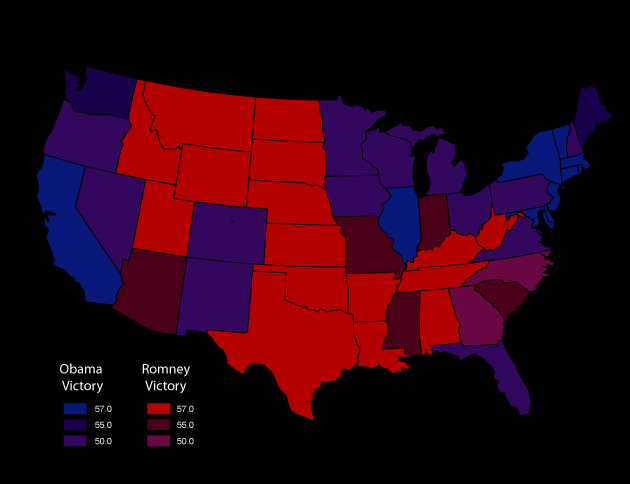
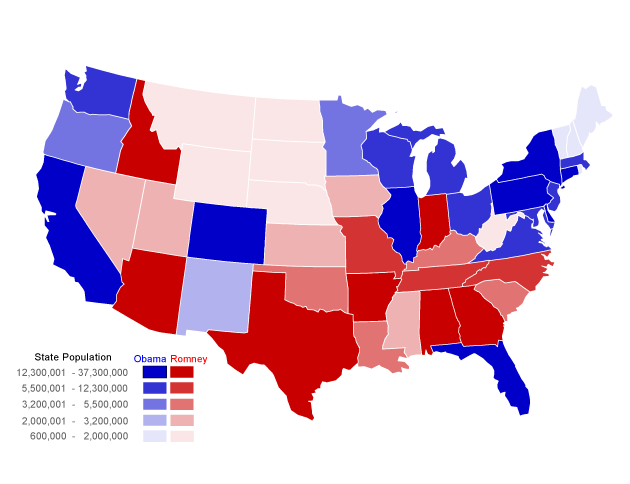
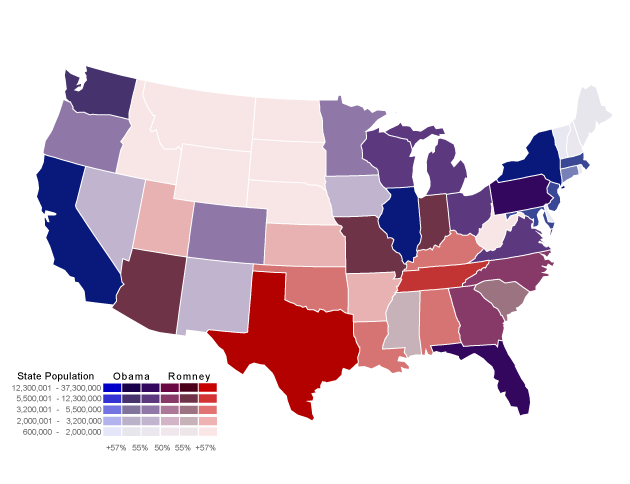
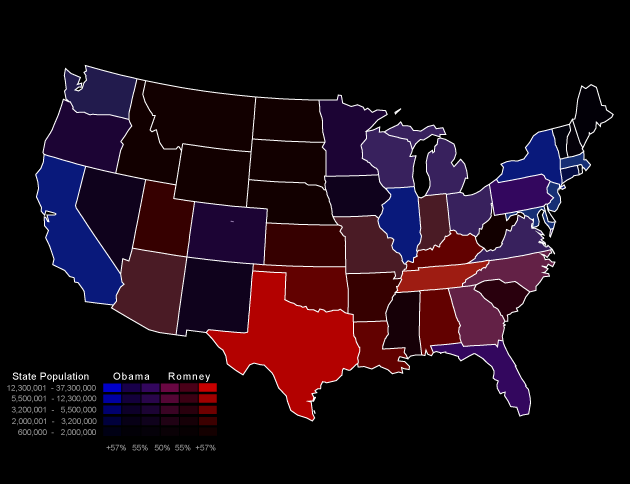
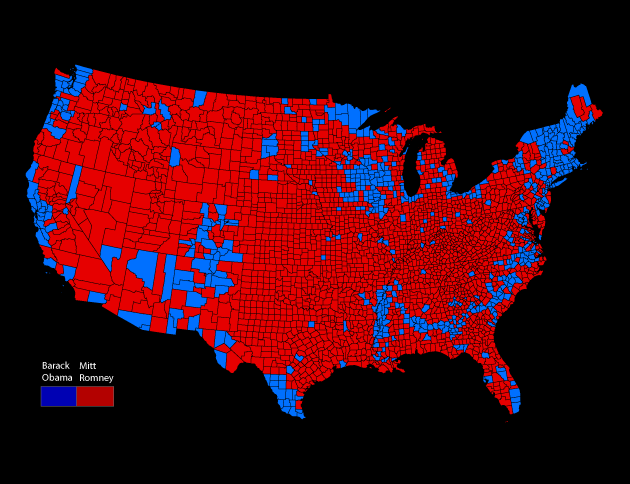
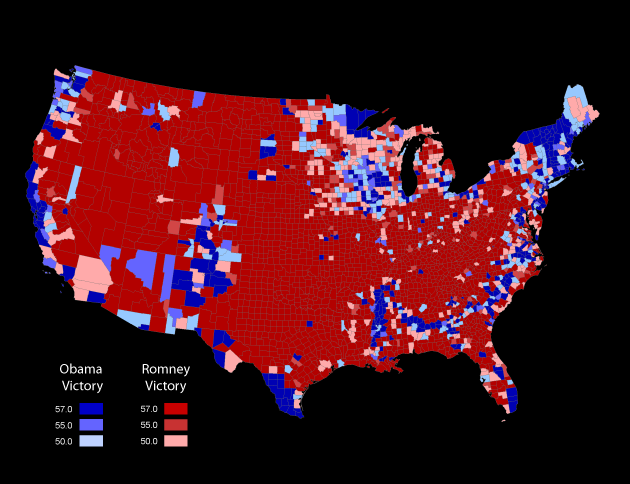
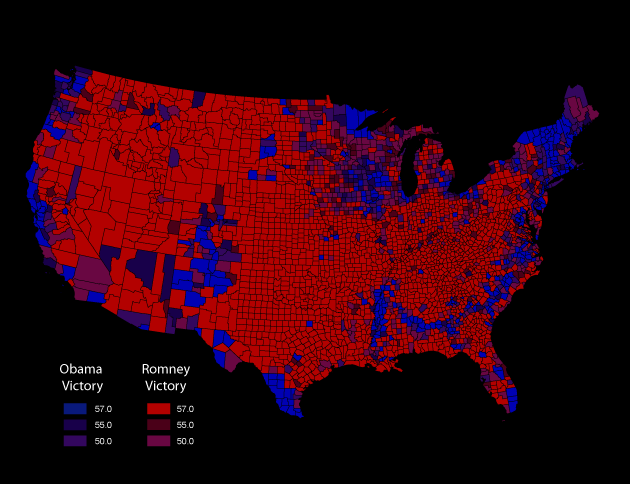
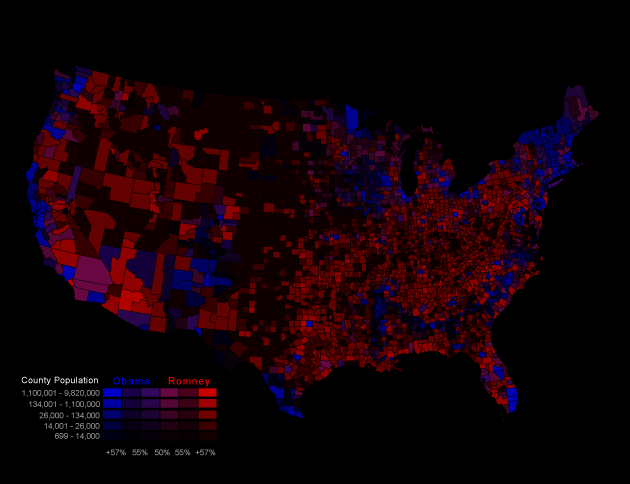
Provided you have an election dataset at the state and/or county level, you can begin in ArcGIS by symbolizing a red/blue map by selecting one of the candidates "percentage of the vote" fields and classifying a break point at 50%, using two classes with red/blue color scheme (for more detailed instructions consult the ArcGIS Resource Center ). Experiment with the idea of red and blue, by that I mean you may find a more attractive color hue than RGB 255,0,0 or 0,0,255 (figures 1, 9). Using the previous technique you can set the symbology to 6 classes, split at 50% again, with increasing, sequential color values on the red and blue color ramps respectively (figures 2, 10), this is a technique often used for interactive prediction maps like fivethirtyeight and other media outlets, prior to the election. Once more, you can implement the same class breaks, this time with red and blue converging on purple (figures 3, 11). These two variations of this red/blue color scheme will serve as the basemap representations for the remainder of this article.
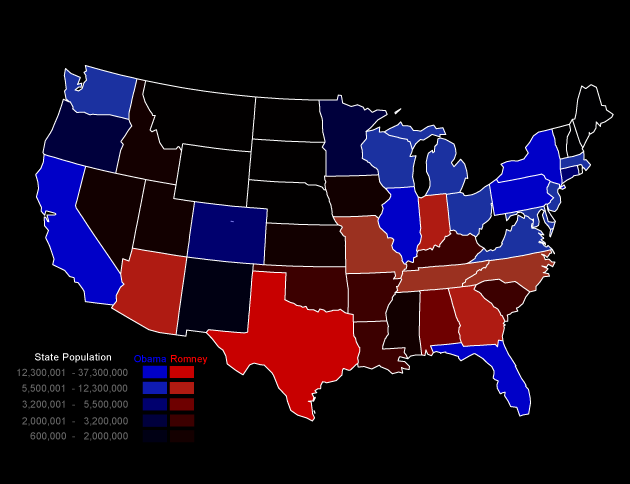
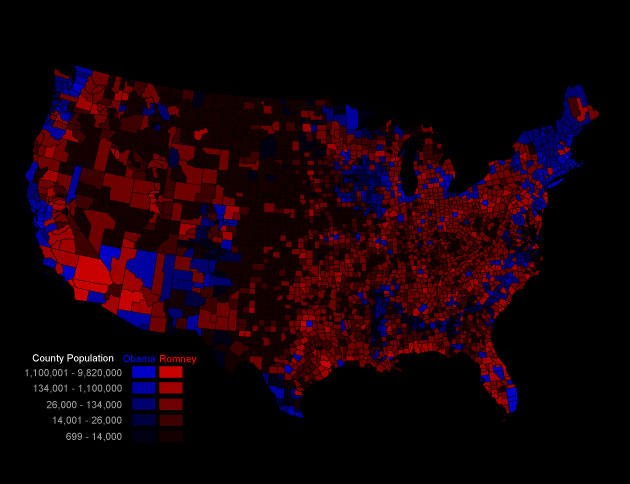
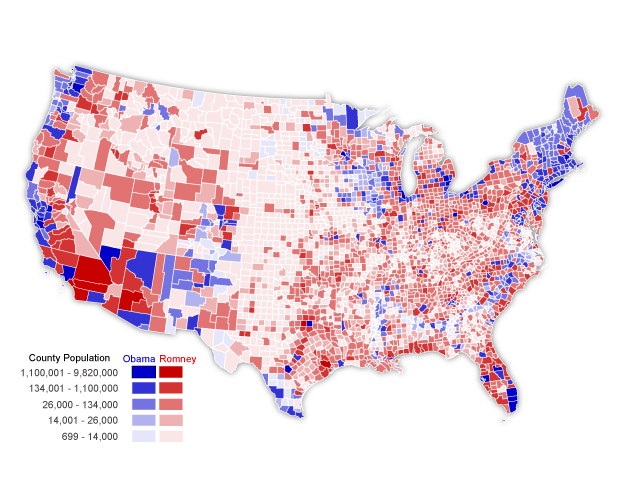
In order to create a value-by-alpha map you must add an additional layer with identical geographic boundaries and it should have a scalar field, such as population, ideally you would just add in the same election layer and join it to a population dataset. Layer this shapefile above your basemap and symbolize it using all black or all white colors and rather than using a diverging or sequential color, use a sequential transparency effect (Roth et al, 2010, 138), you can then experiment with white or black canvasses for aesthetic effect (figures 4-7, 13-15).
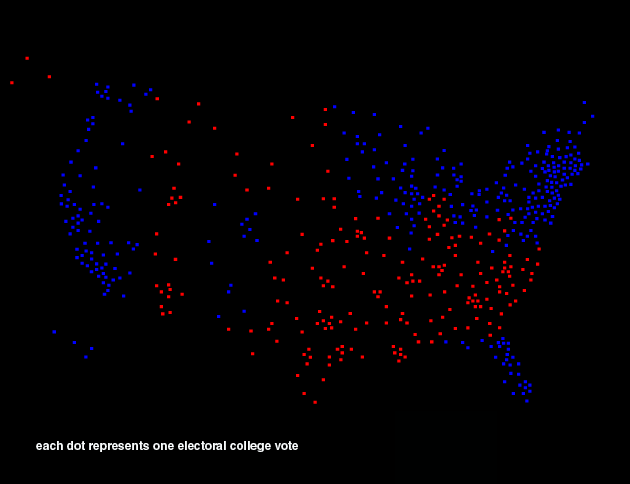
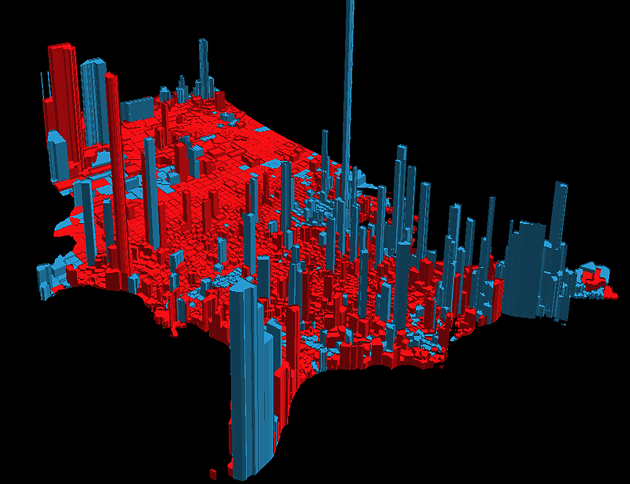
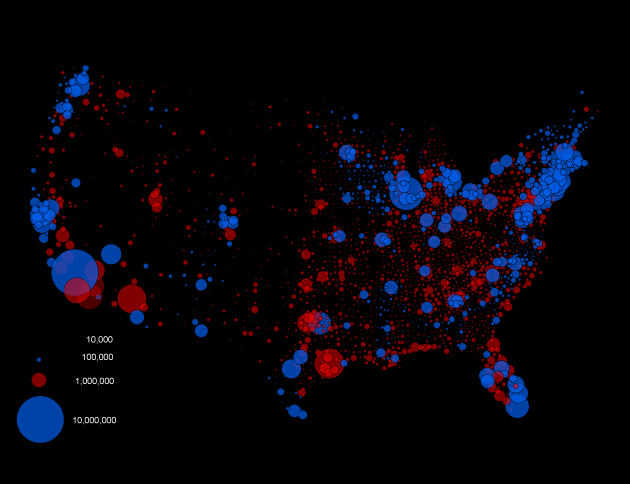
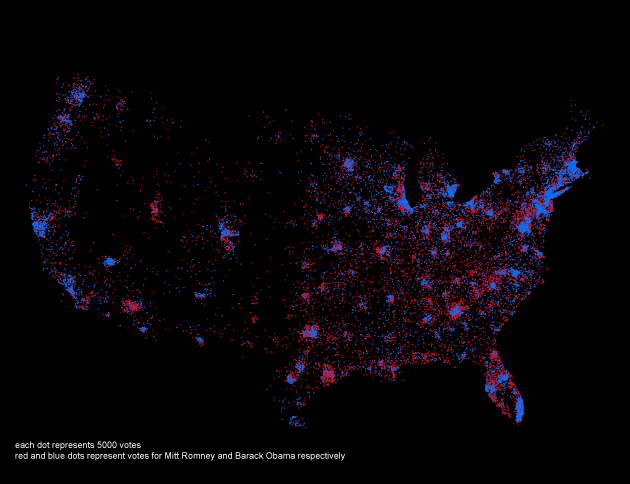
I included a prism map of the county voter results using ArcScene, using population as a scalar field and the typical election color scheme. This representation technique works well as an "Electoral City" map, conceptually mimicking the urban landscape that so often determines our elections (figure 12). Finally, creating a dot or proportional symbol map in ArcGIS is very simple provided you have the dataset. Again, please consult with the ArcGIS Resource Center for detailed instructions for basic ArcGIS functionality. Adding the election layer twice is necessary in order to represent the red and blue symbols respectively, and furthermore, for the dot density map, some manual manipulation is required to layer winning dots above the losers dots. This can be accomplished by layering the respective election winner using the red/blue basemap as a reference map, then manually sending dots to the front or back as necessary both functionally and aesthetically.
I present to you the methods of electoral representation defined in my model. Using ArcGIS, all of these maps were quickly made and presented in an order of the least visually equalized and the least amount of variability within first at the state level, then at the county level, increasing continuously through the model, until the most visually equalized and the most variability within the unit is represented.